Showing posts with label continuous improvement. Show all posts

Tuesday, March 6, 2012

Back on the Front Line of Agility...

Sorry that it has been a while since I posted here - my professional life has changed considerably since I last wrote!

Last Fall I join an exciting startup, VoltDB, leaving behind a "Waterfall to Agile" transformation environment, diving head first into the front lines of a pure Agile start-up environment.

It's been a pretty exciting 6 months working with a great team of engineers.  We're delivering a high velocity, scale-out NewSQL relational database. This product fits at the fire hose intake edge of Big Data and is capable of ingesting hundreds of thousands of transactions per second on commodity hardware.   Low latency, high velocity.  Lots of challenges, both technical and process-wise.

Here's an overview of the VoltDB Development environment:
  • Open Source Database.  Because it is open source, anyone can see the our code (see our Git repository at  https://github.com/organizations/VoltDB).
  • It's a database.  It has to work, can't corrupt or lose data.  Quality is paramount.  
  • We have Continuous Integration system running a large suite of automated tests.
  • VoltDB is in production for a significant number of customers.  There's no dedicated Support team; the Engineering Team provides 24x7 support.
  • We have transparent development: our Product Backlog and Sprint Backlog is hosted (publicly) in JIRA.  We use Greenhopper to plan and track iterations.
  • 3 week iteration.  The product is released almost every iteration!  The Team truly produces a potentially shippable product increment most iterations.
Of course, like every Agile team, we have our share of challenges.  Some of the challenges we experience include:
  • Dealing with unplanned customer support issues as well as pre- and post-sales assistance.
  • Dealing with technical debt.
  • Story sizing: specifically defining small enough slices of potentially shippable functionality.
  • Scaling the team: we're growing fast!
We've adopting Scrum to help us meet these challenges. I'm a firm believer in Agile software development, specifically an Inspect and Adapt framework like Scrum.  Because we're a start-up with a product smack in the middle of a rapidly growing, and evolving, Big Data market, product requirements can change often, sometimes daily. Scrum provides us the framework to adapt to changing business conditions while still regularly producing business value.

It's great being back on the front line of Agility. I hope to find time to blog about these challenges as well as other topics in the coming months, time permitting.


Tuesday, August 9, 2011

Why Agile?


We’re at what I perceive to be a major “transition point” in our Agile transformation.  Most of our Agile pilot teams and projects have successfully completed and we are rolling out internal Scrum training throughout the Product Group.  We’re on the cusp of taking a big step forward with Scrum adoption within our 500 person organization.  It’s at transition points like this when I find myself reevaluating our direction: “Why are we doing this? Are we ready for this next big step?”   Our existing processes do, in fact, lead to shipping product and generating revenue, so: “Why Agile?”

Our original goal, defined we began this transformation, still rings true:

The goal is not to release things faster for the sake of it. It is to achieve nimbleness and agility to deliver on the company’s strategy as it moves forward and/or tactically changes.   It is about creating more business opportunities for ourselves rather than being cased into a model that requires our resource commitment for a time window that is longer than what the market we’re competing in requires.

Specifically, the software development group’s reason for moving from Waterfall to Agile is to achieve nimbleness and agility to deliver on the company’s strategy as it moves forward and/or tactically changes.  We want the ability to efficiently deliver strategic products to market in a timely manner.

Today we have challenges delivering on this goal.  As a mature software organizations our development practices have been hardened over many years of delivering software to tens of thousands of customers.   Our processes have been tempered with the successes (and often, the failures) of the past.    Because of this, it’s difficult to change the current way of doing things.  This is an understandable, and completely human, reaction - but it can dangerous over the long-term.  Fortifying the walls, via policies and procedures as well as organizational divisions, has the result of business being less reactive to change, less agile, which ultimately impacts corporate revenue.   New software releases often take longer to get out the door and may not fully meet customer needs.  Entering new markets in a timely manner becomes difficult, allowing younger more nimble companies a market advantage.   It is for these reasons that we’ve embarked on our development process transformation.

As part of our migration from Waterfall to Agile software development, we need to build a new way of working, including a new corporate culture: one that is nimble and responsive to ever changing business conditions. A culture that values responding to change over following a plan.  One that regularly inspects and adapts, and becomes better over time.  Scrum, with its “inspect and adapt” framework,  is one of the catalysts that can greatly assist us in this journey.

Friday, January 21, 2011

The Burn Down Chart: A Picture is Worth a Thousand Words

Back in the halcyon days of Digital Equipment Corporation (DEC) my team was “volunteered” to  participate in a pilot process improvement effort called Software Metrics In Action (SMIA). As project leader of 10 engineers working on an 18 month project, we were a perfect candidate for this effort of inspecting and adapting and ultimately improving our software development methodology via Software Metrics.  My participation in this process gave me valuable experience with process improvement.  What I didn’t realize at the time was that I was being exposed to many of the key elements of the yet-to-be named Agile software development philosophy.

As I look back to that period of time, I recall measuring every piece of the software development process we could identify. Our team motto was “Data tells the truth about perception.” Seriously!  We measured everything.  We compared task effort ‘actuals’ with ‘predicted’.  We tracked our time for development, test, vacation, dentist and doctor visits, even bathroom breaks, and we had graphs for every data series.  But in the midst of this data collection and evaluation there was one metric that stood out. It was the one ultimate metric that the business owners, our management, was most focused on: the “work remaining”, specifically: when can we ship?   

To track the answer to this question we kept a Microsoft Project schedule that contained only the remaining work.   Each day we adjusted the start date of the project each day to the current day and recomputed the remaining schedule.  As more project work got completed, our knowledge grew and so did our confidence in our task estimates and our release date.   By continually refining our estimates based on new knowledge, we were able to track, in “real time”, the effective project completion date on a daily basis.

My teams effort in our1990’s pilot organically stumbled upon one of the key mechanisms Scrum uses today to track project status. Scrum monitors “work remaining” by using the concept of Burn Down, and in particular, Burn Down Charts.  

Burn Down Charts

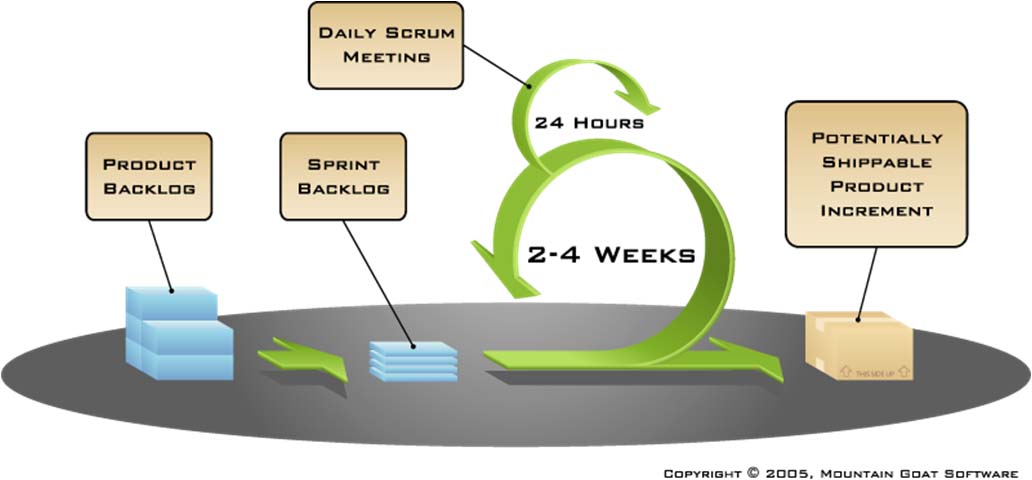
There are two types of burn downs that are generally tracked by a Sprint team, the Sprint Burn Down and the Release Burn Down.  They both operate similarly, but have a different scope.  The Release Burn Down most closely matched my DEC pilot schedule release date monitoring, as it tracks work remaining for the entire project.  The Sprint Burn Down tracks work remaining within a single Sprint, usually 2-4 weeks long.  Because the Progress Agile pilots were of such short duration, each Progress pilot focused solely on Sprint Burn Down Charts.

Understanding how to interpret these charts is important. As a business owner they provide a valuable and near-instant view into the health (or status), of the current effort, be it a Sprint or Release.  

Reading the Charts

A burn down chart is laid out simply: The x-axis denotes number of days in the iteration (or project), the y-axis, for a Sprint Burn, is amount of available time in hours (for a release burn down, it is story points - topic for another blog).  The numbers on this axis are computed by multiplying 8 (hours/day) times the number of team members, assuming each team member is full-time on the effort.
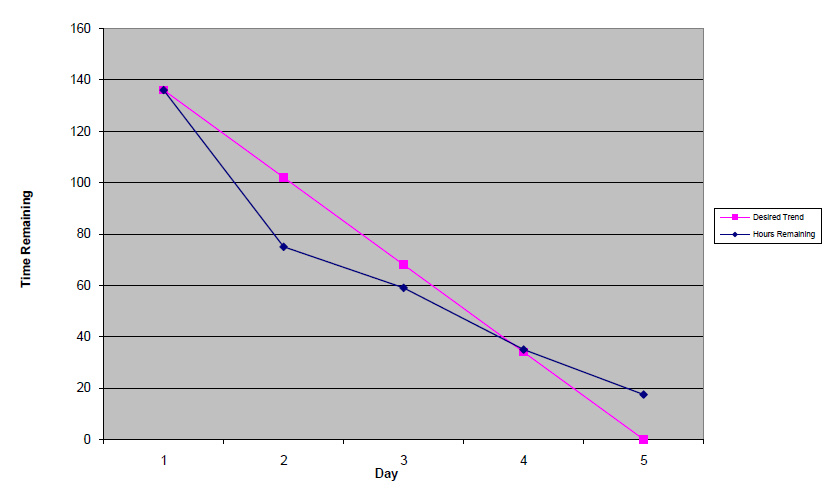
Reading a burn down chart is fairly simple once you understand what to look for.   Burn down charts show a the rate of progress of work being completed compared to the ideal rate of completion of that work.  All burn down charts have one thing in common: the ideal burn down line with the ideal slope.  Note the pink line in the Sprint burn down chart taken from one of our Agile pilot teams.  This pink line shows the ideal rate of progress, specifically that one day of work (8 hours times the number of team members) is completed each day.  There are 5 days of work, the Sprint iteration is 5 days long, and at the end of the sprint, 5 days of team work should be completed.

The pink line is boring. It’s boring because it is our control value, it’s slope is always the same.  In this chart, the interesting line is the blue line.  The blue line denotes the predicted remaining work for the iteration, in essence the current remaining workload of the Sprint.  If everything works out as we hope, at the end of the sprint, day 5 in this example, the blue line will converge exactly with the pink line, at zero work remaining (since there is zero time remaining!).    If we examine this chart on day 2 and day 3, we can see that the team is ahead of schedule, because it is below our control line.  Possibly the team under-committed to work, but regardless, at day 2 it looks like they are on track to meet their commitment to complete everything they said they would.   By day 4 the team is exactly on track.  But something happens by day 5 because they are half-day behind.  Perhaps a team member became sick or perhaps the team discovered some major unknown work at the last day.  Either way, this is likely a bad example I have chosen to discuss because the team missed their commitment and everyone only found out about it the last day.  The retrospective for this Sprint must surely have been interesting!  This chart introduces more questions than it answers, but it encapsulates a interesting story.  It turns out that this sprint was a bug fix sprint, in essence a “release sprint”, designed to produce a customer-shippable technical preview kit.  Bug fixing uncovered further bugs and the team was unable to fix everything they found in time for the release, the end of the sprint.  

Yes, that burn down chart tells quite a story, a thousand words, as they say, and if you are the business owner, it’s your quickest and best view into each project team.

More Examples
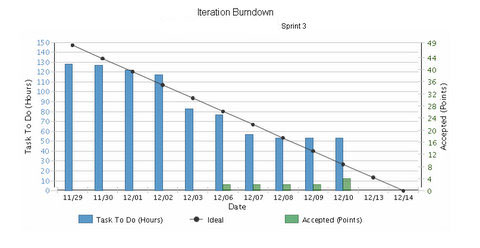
Let’s look at a couple more burn down charts.  In this chart the team is tracking close to the ideal progress line, the black line in this chart format.

The remaining work, Task To Do blue bars, are flirting above and below the ideal.  With 2 days remaining, it is likely this team complete all of their committed work.  In fact, because the remaining work amount hasn’t changed the last few days, it suggests that an inquiry to the ScrumMaster might be needed to see if people simply haven’t been updating work remaining in their effort to complete the Sprint.

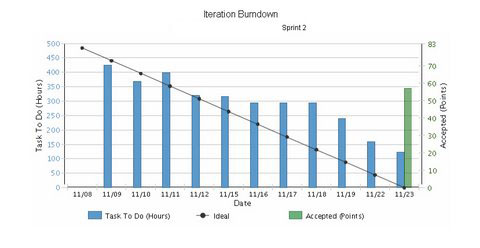
In this final chart below, it looks like the team has over-committed, almost from the start, and true to form, they were unable to complete a bunch of work, just over two days of work.
As you become more comfortable with read burning down charts, you will be able to make project status assessments in a matter of seconds.  Tools such as Rally or VersionOne automatically generate these charts based on user data, or, as with one of our Agile pilots, a standard spreadsheet can be created to plot the team data.

Scrum Metrics

Metrics capture what happened in the past.  With historical metrics, we hope that we can understand the past and adapt more efficiently to similar conditions in the future.  While Scrum values inspecting and adapting, Scrum looks forward for iteration and release status using burn down charts.  

Incidentally, my Digital Equipment Corp Software Metrics in Action pilot was deemed a success: our 18 months development project was released 1 day ahead of our original schedule.  You can’t change the past, but sometimes you can predict the future...