In one of my earlier Blog postings, I responded to a comment and stated that I believed that “Scrum aims to make managing software development easy”. I believe this is true because the core of Scrum is the self-empowered, self-organizing Team. In its simplest form, a Scrum Team is fed a prioritized list of user stories and the Team commits to delivering some set of top stories in a fixed amount of time. Because the team is empowered, it is up to the team itself to figure out to divide the work between themselves and deliver “done” stories by way of a potentially shippable product at the end of the sprint.
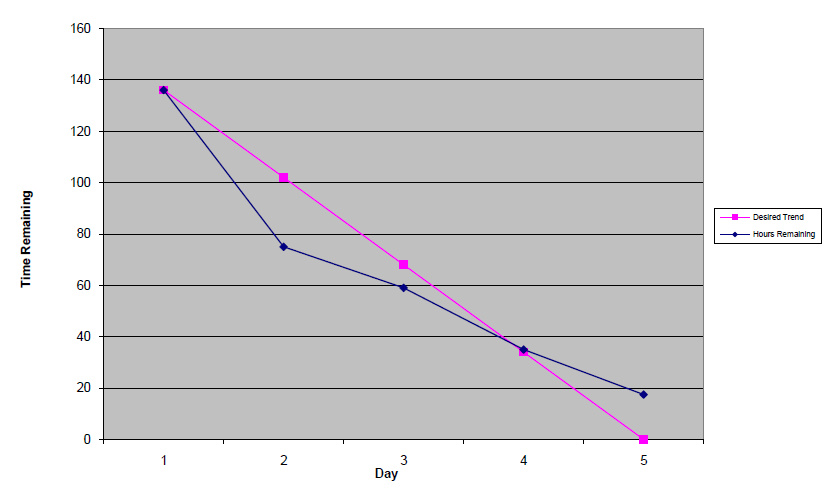
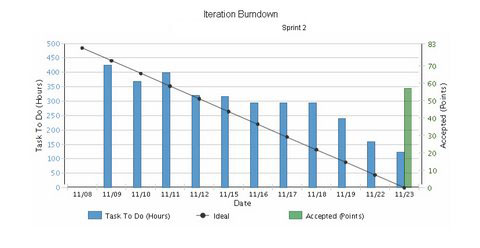
As an Engineering Manager, I can sit back and watch an established Scrum team crank through their work. I can readily track the Team’s work via burn down charts and the Scrum task board. In fact, I was able to do just that during our recent Pilot with the Tool team.
A fully-functioning Scrum team will ask for help from the appropriate people, usually Subject Matter Experts (SME) and Product Owners (PO), and will inspect and adapt to make their work more efficient. When any blocking issues occur, often called impediments, the team will raise these issue to their ScrumMaster. Nowhere in the Agile Manifesto or Scrum Guide is a role for Engineering Manager defined.
Because there is no need for day to day management and oversight of a Scrum team, the traditional software engineering manager may feel marginalized, perhaps assuming that their primary responsibility is writing annual performance reviews. Ugh, what a horrible role that would be. Thankfully this couldn’t be further from the truth, particularly during the process of transforming from a Waterfall process to an Agile one.
 A Manager’s Top Priority
A manager’s top priority is to put their employees in a position such that they have the best opportunity to succeed. In a Waterfall environment, this usually means breaking down and assigning the work, working to identify and resolve cross-team dependencies, managing the team’s schedule, and communicating release status to upper management. The common thread for these activities is that they facilitate the Waterfall development process.
In an Agile environment, a manager’s goal is the same, to create the best environment possible for that allows their employees to succeed. But facilitating the development process in Scrum is very different. Initially with Scrum, a manager has to be a champion for the process and help employees unlearn roles and responsibilities they’ve grown accustom to in Waterfall. With Scrum, first and foremost, it is a Team effort versus an individual one. The Team makes a commitment to work together and do all the work necessary to deliver “done” user-stories. This can’t be understated. It may be hard for a manager to defer to the team and let the team self-organize, but once a manager “let’s go of the reins” and lets the team “figure it out”, their real work begins.
An Agile Manager’s Real Work
The first job of a manager is to assemble the right people for each Scrum team. The skills and personalities needed for a waterfall-oriented team are often drastically different than needed for an Agile team. Because Scrum teams deliver vertical increments of functionality teams members may need to be more cross-functional than siloed. For example, rather than a team of User Interface engineers, a more appropriate team would include UI, middleware and database engineers, covering features from the front-end all the way to back-end. This may require a more matrix-oriented organizational reporting structure or changes to the existing organization, something that may ruffle territorial feathers. But such changes may ultimately what is best for the organization, and a manager should accept and adapt.
Managers have a broader understanding of the business, and can also act as subject matter experts (SME), providing coaching to the team as requested, and additionally participating in the Sprint Reviews where feedback on delivered functionality can be voiced.
In addition, managers should also consider and account for external influences that may impact the team. Because the team has committed to a delivering features in a time-boxed iteration, managers should make it one of their top goals to keep the team from being interrupted. Team priorities are managed via the Product Backlog and short sprints give Product Owners frequent opportunity to re-prioritize work. Managers should strive to block interrupts during a Sprint, by either pushing back on the intrusion or pre-identify organizational capacity for predicted interrupts such as software maintenance. I could go on and on about this as I feel strongly about this point. The Team makes a strong commitment to deliver on the stories. Managers should respect that and equally make a strong commitment to protect them from interrupts and priority-shifts during the Sprint.
Perhaps one of the most important roles a manager has in Scrum is to address team impediments. A manager should regularly connect with the ScrumMaster to understand and work to eliminate impediments identified by the team. Impediments may be easy to remove, such as finding budget money for new hardware (perhaps not so easy!), or may sound impossible, as in fixing the timezone issues between the U.S. and India. Regardless, addressing impediments of all shapes is critical to the health and productivity of the team and it is ultimately managements responsibility to address these issues that can’t be addressed by the team. Impediments offer an opportunity to think out of the box and to operationally improve organizational efficiency. Here, out of the box thinking and sometimes creative organizational changes can make a huge impact to the team. It’s a perfect opportunity for the manager to challenge “the way things have always been done.” Removing impediments could almost be a full-time job, particularly for an organization transforming from Waterfall to Agile.
Some final thoughts on a manager’s role in Scrum: A manager should never be the ScrumMaster for teams containing direct reports, as this, in practice, breaks team self-organization. Some companies have, however, had success with managers acting as co-Product Owner. Engineering Managers partner with Product Managers, with the Engineering Managers focusing inward on the team, and the Product Managers facing outward to the customers. This role may work where the manager has a strong technical background and the team is without an Architect or strong full-time Product Manager.
Agents of Transformation
Over the past year we’ve asked each Agile pilot team to drastically change the way they work, by holding daily stand-ups, tracking and publishing Sprint burndown and regularly delivering potentially shippable software every 2 weeks. But as managers we’ve essentially kept our day-to-day work environment unchanged.
Converting from Waterfall to Scrum forces engineering managers to change their day-to-day activities within the organization. Rather than “owning” the project schedule, their role shifts to enabling and coaching self-organizing teams as well as removing impediments. But I’d offer up that the role goes a step further: as Managers, the organizational transformation starts with us, the business owners.
Agile development challenges us to see beyond the “this is the way we’ve always done it” mantra. Just because it “is”, that doesn’t mean it “has to be”. And there lies the opportunity for transformation. As the management leaders of this company, it is our responsibility to not only facilitate this transformation, but to also partake in it ourselves.
As an Engineering Manager, I can sit back and watch an established Scrum team crank through their work. I can readily track the Team’s work via burn down charts and the Scrum task board. In fact, I was able to do just that during our recent Pilot with the Tool team.
A fully-functioning Scrum team will ask for help from the appropriate people, usually Subject Matter Experts (SME) and Product Owners (PO), and will inspect and adapt to make their work more efficient. When any blocking issues occur, often called impediments, the team will raise these issue to their ScrumMaster. Nowhere in the Agile Manifesto or Scrum Guide is a role for Engineering Manager defined.
Because there is no need for day to day management and oversight of a Scrum team, the traditional software engineering manager may feel marginalized, perhaps assuming that their primary responsibility is writing annual performance reviews. Ugh, what a horrible role that would be. Thankfully this couldn’t be further from the truth, particularly during the process of transforming from a Waterfall process to an Agile one.

A manager’s top priority is to put their employees in a position such that they have the best opportunity to succeed. In a Waterfall environment, this usually means breaking down and assigning the work, working to identify and resolve cross-team dependencies, managing the team’s schedule, and communicating release status to upper management. The common thread for these activities is that they facilitate the Waterfall development process.
In an Agile environment, a manager’s goal is the same, to create the best environment possible for that allows their employees to succeed. But facilitating the development process in Scrum is very different. Initially with Scrum, a manager has to be a champion for the process and help employees unlearn roles and responsibilities they’ve grown accustom to in Waterfall. With Scrum, first and foremost, it is a Team effort versus an individual one. The Team makes a commitment to work together and do all the work necessary to deliver “done” user-stories. This can’t be understated. It may be hard for a manager to defer to the team and let the team self-organize, but once a manager “let’s go of the reins” and lets the team “figure it out”, their real work begins.
An Agile Manager’s Real Work
The first job of a manager is to assemble the right people for each Scrum team. The skills and personalities needed for a waterfall-oriented team are often drastically different than needed for an Agile team. Because Scrum teams deliver vertical increments of functionality teams members may need to be more cross-functional than siloed. For example, rather than a team of User Interface engineers, a more appropriate team would include UI, middleware and database engineers, covering features from the front-end all the way to back-end. This may require a more matrix-oriented organizational reporting structure or changes to the existing organization, something that may ruffle territorial feathers. But such changes may ultimately what is best for the organization, and a manager should accept and adapt.
Managers have a broader understanding of the business, and can also act as subject matter experts (SME), providing coaching to the team as requested, and additionally participating in the Sprint Reviews where feedback on delivered functionality can be voiced.
In addition, managers should also consider and account for external influences that may impact the team. Because the team has committed to a delivering features in a time-boxed iteration, managers should make it one of their top goals to keep the team from being interrupted. Team priorities are managed via the Product Backlog and short sprints give Product Owners frequent opportunity to re-prioritize work. Managers should strive to block interrupts during a Sprint, by either pushing back on the intrusion or pre-identify organizational capacity for predicted interrupts such as software maintenance. I could go on and on about this as I feel strongly about this point. The Team makes a strong commitment to deliver on the stories. Managers should respect that and equally make a strong commitment to protect them from interrupts and priority-shifts during the Sprint.
Perhaps one of the most important roles a manager has in Scrum is to address team impediments. A manager should regularly connect with the ScrumMaster to understand and work to eliminate impediments identified by the team. Impediments may be easy to remove, such as finding budget money for new hardware (perhaps not so easy!), or may sound impossible, as in fixing the timezone issues between the U.S. and India. Regardless, addressing impediments of all shapes is critical to the health and productivity of the team and it is ultimately managements responsibility to address these issues that can’t be addressed by the team. Impediments offer an opportunity to think out of the box and to operationally improve organizational efficiency. Here, out of the box thinking and sometimes creative organizational changes can make a huge impact to the team. It’s a perfect opportunity for the manager to challenge “the way things have always been done.” Removing impediments could almost be a full-time job, particularly for an organization transforming from Waterfall to Agile.
Some final thoughts on a manager’s role in Scrum: A manager should never be the ScrumMaster for teams containing direct reports, as this, in practice, breaks team self-organization. Some companies have, however, had success with managers acting as co-Product Owner. Engineering Managers partner with Product Managers, with the Engineering Managers focusing inward on the team, and the Product Managers facing outward to the customers. This role may work where the manager has a strong technical background and the team is without an Architect or strong full-time Product Manager.
Agents of Transformation
Over the past year we’ve asked each Agile pilot team to drastically change the way they work, by holding daily stand-ups, tracking and publishing Sprint burndown and regularly delivering potentially shippable software every 2 weeks. But as managers we’ve essentially kept our day-to-day work environment unchanged.
Converting from Waterfall to Scrum forces engineering managers to change their day-to-day activities within the organization. Rather than “owning” the project schedule, their role shifts to enabling and coaching self-organizing teams as well as removing impediments. But I’d offer up that the role goes a step further: as Managers, the organizational transformation starts with us, the business owners.
Agile development challenges us to see beyond the “this is the way we’ve always done it” mantra. Just because it “is”, that doesn’t mean it “has to be”. And there lies the opportunity for transformation. As the management leaders of this company, it is our responsibility to not only facilitate this transformation, but to also partake in it ourselves.